Product Designer, Nagarro Digital Ventures · Client engagement since Jan 2025
Overview
Moody’s is a global provider of data, analytics, and risk assessment solutions used by organizations operating in highly regulated and high-stakes environments. As a product designer within Nagarro Digital Ventures’ engagement, I’ve worked across five platform products: Data AdminThe platform layer governing user access, permissions, and infrastructure across all IRP products., Data BridgeA Moody’s product connecting an organization’s own infrastructure to its risk data, including secure VPN access., Risk Data LakeA Moody’s product where insurance and reinsurance risk data is stored and queried, like a data warehouse built for the industry., Exposure IQA Moody’s product for analyzing insurance risk exposure geospatially, mapping where risk concentrates across a portfolio., and TreatyIQA Moody’s product for reinsurance treaty analysis and portfolio management., auditing and redesigning an AI-generated chat agent against our own design system, restructuring the design system into a token-based architecture, redesigning data administration and access control, and rebuilding error messaging and analysis logs, so analysts across financial services, insurance, and public sector contexts can confidently navigate, understand, and act on critical data.
5Platform products designed for
1-2PMs per product
200+Engineers across all IRPIntelligent Risk Platform: Moody’s suite of insurance and reinsurance risk products. products
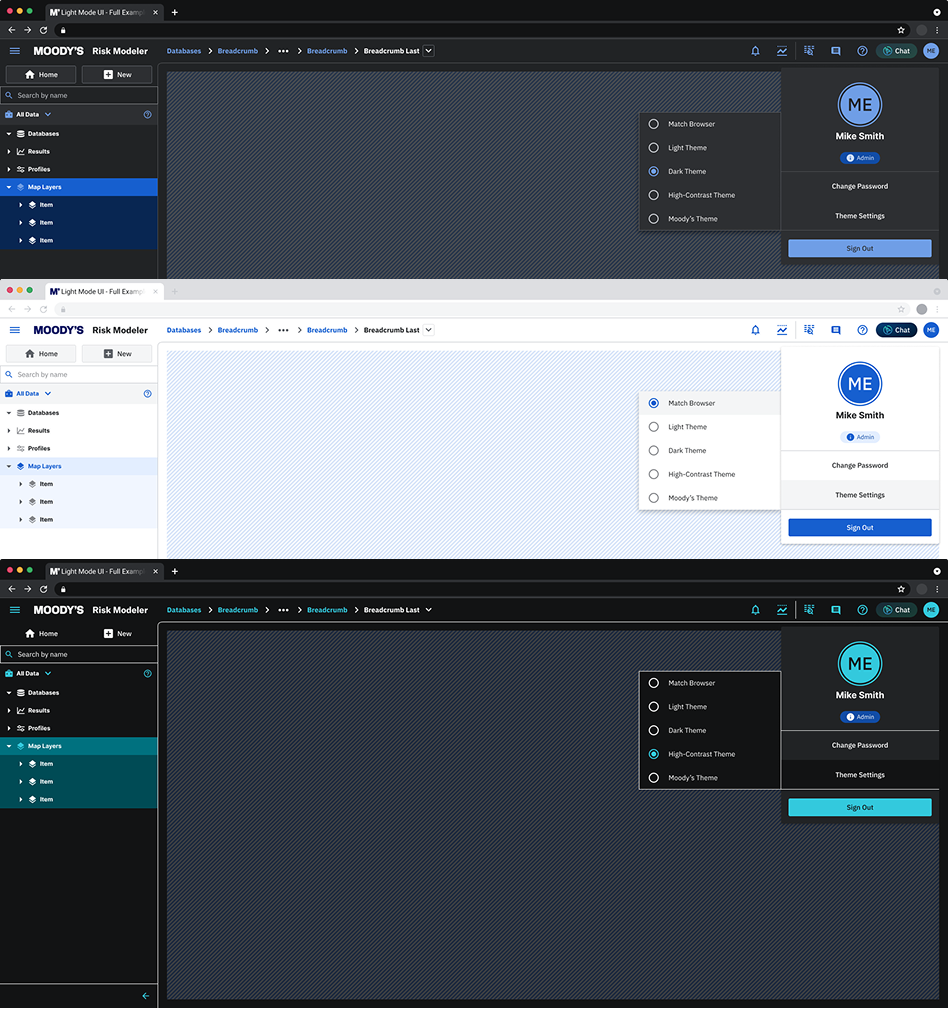
3Themes shipped: Light, Dark, High Contrast
40+Countries served by these platforms
The work sits inside Nagarro Digital Ventures’ broader engagement with Moody’s, aligning closely with cross-functional teams across the client organization to make dense, high-stakes data tools feel more intuitive without losing their depth.
Problem Space
Moody’s products operate in a highly technical domain, where users navigate large volumes of structured and unstructured data, perform advanced tasks like querying, cataloging, and risk analysis, and expect precision, transparency, and performance throughout.
Key challenges identified across the initiatives I’ve worked on
Fragmented workflows between tools and external platformsSteep learning curve for non-technical usersLimited discoverability of data assets and actionsInconsistent UX patterns across integrated solutions
My Role & Approach
Contextual Discovery. Deep understanding of JTBDs, system constraints, and technical dependencies.
UX Mapping. Mapping end-to-end flows across embedded and native experiences.
Component-Led Design. Designing within existing design systems while extending them when needed.
Iterative Validation. Regular syncs with PMs and engineers to validate feasibility and alignment.
Future-Facing Thinking. Designing not only for current needs, but for upcoming AI-based workflows.
Key Initiatives & Contributions
Four initiatives I led in depth, spanning AI-assisted workflows, design systems, platform governance, and error handling. Expand each for the full scope, approach, and outcomes.
Risk Data LakeDesigning the RDL AI Agent for Non-SQL Users
The RDL AI Agent is a conversational assistant inside Risk Data Lake that lets non-SQL users, including underwriters, portfolio managers, and analysts, ask questions about risk data in plain English and get back an answer with the data, the chart, and proof of where it came from.
Problem: anyone who couldn’t write SQL depended on an analyst for even a quick number, so everyday questions waited in a queue behind full ad hoc analysis work.
The challenge
The PM took the requirements and, using an AI rapid-prototyping tool, turned them into a clickable chatbot prototype independently. It’s a small but telling sign of how design and product roles are shifting as AI tools make it possible to go from requirements to a working UI without a designer in the loop. The prototype captured the scope, but it had no grounding in our actual design system: our team’s own rapid-prototyping monorepo, built on RadiusMoody’s official design system and component library, used across production IRP products. components and CSS tokens, with documentation written specifically for LLMs to follow. It was visually improvised from scope alone, not built from real patterns.
That forced a question I hadn’t had to answer this directly before: what is my role when a non-designer can already produce a “good enough” clickable prototype with AI?
My answer was to shift from making the pixels to auditing them: using the prototype as a starting point, not a finished design, and checking it against its own requirements and against usability best practices.
What the audit found
No one-click hand-off from a generated SQL query into the actual SQL editor, only a copy button, so “show your work” was only half-built.
Source citations and result counts stayed visible, sometimes duplicated, even on failed responses, undermining the one rule that mattered most: don’t show what you can’t back up.
No way to cancel a request while the agent was “thinking,” leaving people stuck waiting out a frozen-feeling state.
Entry points and example prompts were written in raw SQL/schema language, defaulting the whole experience toward the one persona who didn’t actually need it.
The agent’s own entry point was an unlabeled icon, undiscoverable despite being the platform’s headline new capability.
Extending the system, not working around it
Roughly a quarter of what the chat interface needed, things like message bubbles and sender/receiver treatment, didn’t exist in the core design system yet. Rather than hardcoding one-off components for this feature, I used atomic design principles: building new patterns as atoms of the existing library, so the system grows instead of collecting exceptions to it.
Turned the audit findings into finalized screens, built through the design team’s prototyping practice, that close each gap: a one-click SQL editor hand-off, a cancel control, corrected citation behavior on failed responses, and persona-appropriate entry points and prompts.
The finalized experience is on track for its opt-in preview launch, built from validated interaction patterns and closed audit findings rather than new concept exploration.
Why it mattered
AI tools are changing who can produce a first draft of an interface, but that draft still needs someone accountable for whether it’s usable, trustworthy, and consistent with the system it has to live inside. Auditing the prototype instead of dismissing it kept the team moving at AI speed without inheriting a shortcut’s worth of design-system debt.
Design System & ThemingRestructuring the Design System Into Design Tokens
The existing design system wasn’t structured around tokens, which limited scalability and made theming difficult to implement and maintain. This work ran in parallel with feature delivery, prioritizing critical components first to avoid blocking product roadmap commitments.
Objective: enable scalable theming (Dark Mode and High-Contrast) by restructuring the existing design system into a token-based architecture, ensuring accessibility, consistency, and engineering feasibility across data-dense products.
Key contributions
Led the restructuring of the design system into a token-based model, defining semantic tokens (intent-based, theme-agnostic) and component tokens (contextual, reusable, and scalable).
Mapped legacy styles and components to the new token structure, identifying gaps and inconsistencies.
Defined token usage guidelines to support multiple themes without breaking hierarchy or meaning.
Worked hands-on with engineering, aligning design decisions with implementation constraints and validating feasibility early.
Outcomes
Established a scalable foundation for theming across the platform.
Unblocked Dark Mode and High-Contrast implementation without design debt.
Improved accessibility, contrast consistency, and long-session usability.
Strengthened design and engineering collaboration through shared system ownership.
Platform GovernanceRedesigning Data Administration & Access Control
While analysts and modelers work directly with risk data, Data Admin sits in between all IRP products, ensuring the platform functions safely, reliably, and at scale. This layer governs who can access what, how data flows between environments, and how systems are maintained over time.
Scope of work: platform operations, governance, and cross-product enablement.
Key contributions
Designed and refined experiences for user and role management, including permissions and access control across all products.
Contributed to flows for secure connectivity and VPN setup, reducing friction in complex infrastructure onboarding.
Worked on database management and archiving workflows, supporting data lifecycle, compliance, and long-term maintainability.
Helped define clear UX patterns for administrative actions such as configuration, validation, and system feedback.
The VPN work shipped publicly as Moody’s VPN for Data Bridge, see the official announcement for the shipped result.
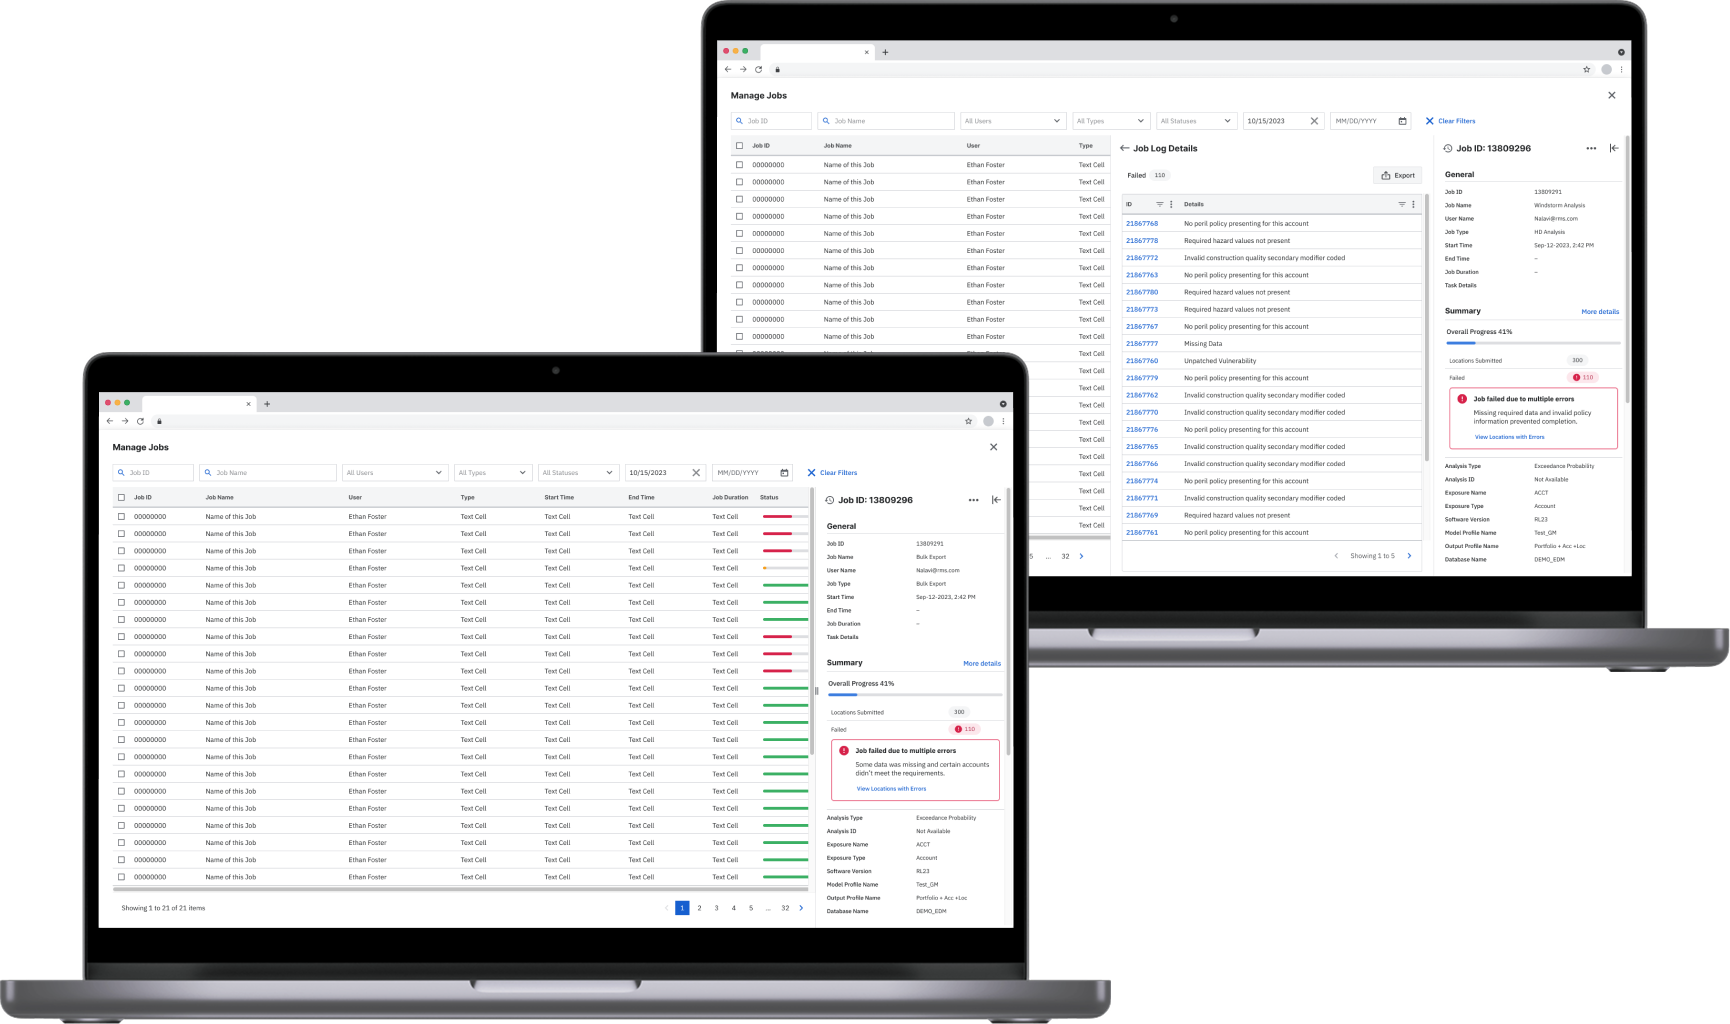
In complex analytical systems, errors are inevitable. What matters is not whether something fails, but whether users can understand why it failed and what to do next. The system communicated failures in a highly technical manner, leaving users without a clear path to resolution.
Users had limited visibility into why model runs failed or partially completed. Skipped locations and technical errors were difficult to trace back to specific input data issues, which increased troubleshooting time, led to repeated trial-and-error reruns, and created unnecessary dependency on support teams.
Personas
Risk Analysts: need to quickly understand why a model run produced incomplete or unexpected results.
Catastrophe Modelers: require precise feedback to correct input data and rerun models efficiently.
Data Engineers: depend on structured logs to trace issues and validate data.
Approach
Led UX requirements gathering in close collaboration with Product, Engineering, and Subject Matter Experts.
Framed the problem using Jobs to Be Done, aligning system constraints with real user goals.
Established a clear conceptual distinction between warnings (informational, non-blocking) and errors (action required).
Designed the experience as a layered communication model: immediate, human-readable messages paired with deeper, structured analysis logs.
Outcome
Designed a structured analysis log, readable by humans and consumable by machines (CSV / JSON), including location identifiers, exclusion reasons, and severity classification.
Introduced interaction patterns that support sense-making: expanding and collapsing detailed entries, filtering by severity or error type, and copying and exporting logs for collaboration or auditing.
Error handling shifted from a reactive, support-driven process to self-service problem solving.
Other Initiatives Across the Platform
A quick look at a couple more initiatives across the platform’s five products, to show the range of problems I work on beyond the four above. Expand each for a quick overview.
Risk Data LakeEmbedding a SQL Editor Into the Platform
Today, clicking “SQL” inside Risk Data Lake redirects users to Databricks in a separate window, an experience disjointed from the rest of the platform. I scoped and designed an embedded SQL editor and data catalog so analysts never have to leave the product to query their own data.
Design approach
Mapped the workflow end to end across 7 distinct interface states, from an empty landing state through catalog discovery, multi-tab query authoring, execution, results, and query history.
Balanced power-user functionality (code editing, multi-tab queries, catalog browsing) against clarity and hierarchy, so the tool stays approachable for less technical users too.
Designed the information architecture to extend cleanly into future capabilities (Notebook, AI Assistant) without a redesign, rather than solving only for the SQL editor in isolation.
Why it mattered
This wasn’t just a UI request. It was a foundation decision: every future analytics capability on Risk Data Lake would sit on top of this catalog and editor pattern, so getting the information architecture right upfront mattered more than any single screen.
Exposure IQScoping Geospatial Analytics for Non-Technical Users
Underwriters and portfolio managers needed to analyze risk exposure geospatially, understand what was driving their portfolio, and spot growth opportunity, all without GIS expertise. This wasn’t a feature ask; it was a new product surface entering a market segment the platform hadn’t competed in before.
Scope & complexity
Scoped across 5 distinct user segments, from primary users (underwriters, portfolio managers, brokers) to secondary ones (ILS fund managers, claims teams), each with a different job to be done.
Spanned 6 workflow areas: bringing in your own geospatial data, map and scoreboard enhancements, saved views and reusable templates, accumulation analysis, notifications, and underwriter-specific quoting flows.
Aligned the design across 8 cross-functional engineering and QE teams, so the scope shipped as one shared mapping component rather than a one-off feature.
Why it mattered
The saved “map views” and “map templates” pattern was the key design decision: without it, every analysis would mean rebuilding the same filters and layers from scratch, which would have made the whole capability unusable at real-world scale.
This project is under NDA: some designs and details can’t be shown publicly. Reach out directly for more.